On Friday afternoon, April 28, 2017, a stalled front reaching from southeast Missouri into Arkansas and Oklahoma began to move north as a warm front, and moisture from the Gulf of Mexico streamed up over it. Through Saturday a series of low-pressure waves ran northeast along the front, and storm after storm crossed the same ground. By Sunday night most of the country covered by the Weather Service office in Springfield had received four to eight inches of rain, and some areas in the far south and south-central parts of the state ten to twelve. A weather station near Mountain View recorded 9.25 inches. A rain Gauge. A station of the Geological Survey that records the river’s stage, from which its flow is figured. The Jacks Fork has gauges at Highway 17, Alley and Eminence (Chapter 14). Glossary → at Eminence recorded a little over sevenNational Weather Service, Springfield 2017 (Mountain View RAWS 9.25 inches; Eminence 7.11 inches)., and the gauge at the forest ranger station at Winona, south of Eminence, 9.29 inches in the three days and nearly twelve by May 10. It was the second-wettest April in Missouri in 123 yearsHeimann, Holmes and Harris 2018, 3 (April 2017 “the second wettest April on record in Missouri (123 years of record)”), 15 (fig. 8: Winona Forest Ranger Station, 9.29 inches April 28–30 and 11.92 inches April 28–May 10). of records.
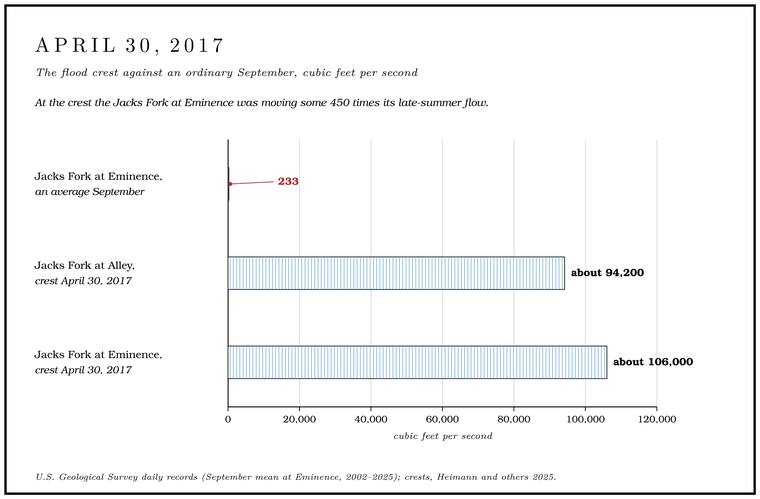
On April 30 the Jacks Fork at Alley rose to 23.29 feet on the gauge and carried about 94,200 cubic feet of water a second. At Eminence it reached 27.72 feet and about 106,000 cubic feet a second, the highest water known thereNational Weather Service, gauge pages (EMCM7, crest history; the next highest is 27.00 feet in 1904).. That is close to 800,000 gallons106,000 × 7.48. passing the town every second, or the flow of nearly eight hundred Alley Springs106,000 ÷ 135, Alley Spring’s average flow over its gauged years (Wilson 2001, 2; see Chapter 12). on an average day. In an average September the river at Eminence carries about 233 cubic feet a secondUSGS NWIS, gauge 07066000, monthly statistics 2002–2025 (Table 14.1)., so at the crest it was moving some 450 times106,000 ÷ 233. its late-summer flow. The Current at Van Buren crested the same day at 179,000Heimann and others 2025, 6 (table 1). The Weather Service’s crest history gives the 2017 flow at Alley as 92,400.. The Jacks Fork drains less than a quarter of the land above Van Buren, and at its peak it carried close to three-fifths398 ÷ 1,667 square miles; 106,000 ÷ 179,000 (Heimann and others 2025, 6, table 1). as much water as the Current did there.
The same river can shrink to a trickle. On July 29, 2012, the gauge at the Highway 17 bridge at Steel Bridge recorded a daily average of 12.9 cubic feet a second, the lowest sinceUSGS NWIS, gauge 07065200, daily values and daily statistics, 2002–2026. it began measuring flow in 2001. In the month of April 2017 the same gauge averaged 1,625USGS NWIS, gauge 07065200, monthly statistics..
Three gauges
The U.S. Geological Survey measures the Jacks Fork at three places. The oldest gauge is at Eminence, a mile and a half below the mouth of Mahans Creek, where the daily record begins in 1921; it measures the runoff from 398 square miles. The second is at Alley, half a mile above the mouth of the Spring branch. The stream that runs from a spring to the river, such as the branch below Alley Spring (Reach H). Glossary →, so it measures the river before Alley Spring joins it. It has run since 1993 and drains 298 square miles. The third, at the Highway 17 bridge (Reach D), began recording the water level in February 2000 and the flow in October 2001USGS NWIS, gauge 07065200., for 185 square milesHeimann and others 2025, 6 (table 1).. Alley Spring’s own Branch. A small creek. The sense is American, on record from 1674 (Chapter 18). Glossary → was gauged from 1928 to 1939 and again from 1965 to 1979MDC 2001, PDF 68 (which dates the Eminence record from October 1921; the daily values in USGS NWIS begin November 1, 1921). (Chapter 12), and from 1921 to 1975 a gauge on the Current measured the river just below the mouth of the Jacks ForkWilson 2001, 2 (“below the junction”)..
Each gauge reads the water level every fifteen minutes and sends the readings by satellite radio every hourHeimann and others 2025, 4. to the Survey’s public water-data system. The National Weather Service displays the readings and forecasts the water level for Alley and EminenceHeimann and others 2025, 1–2.. It makes no forecast for the gauge at Highway 17National Weather Service, gauge pages (JKFM7)..
What a gauge reading means
Flow is counted in Cubic feet per second. The usual measure of a river’s flow, the volume of water passing a point each second. A flow of 100 cubic feet a second is about 65 million gallons a day (Chapter 12; Chapter 14). Glossary →, the volume of water passing a point each second. A cubic foot holds about seven and a half gallons, so the 233 cubic feet of an average September day at Eminence is about 1,700 gallons233 × 7.48. a second.
A gauge does not measure flow directly. It records the Stage. The height of the water surface above a gauge’s datum, the reading a gauge records. A stage differs from the depth of the water. At Eminence the datum stands 616.18 feet above sea level (Chapter 14). Glossary →, the height of the water surface above a fixed zero called the gauge datum. At Highway 17 the datum is 836.06 feet above sea level, at Alley 656.95Heimann and others 2025, 6 (table 1). feet and at Eminence 616.18National Weather Service, gauge pages (EMCM7, NAVD 88); consistent with Heimann and others 2025, table 3 (a 6-foot stage at 622.18 feet). Heimann and others 2025, table 1, prints 546.60 for Eminence, the figure given for the Current above Powder Mill. feet. A stageHeimann and others 2025, 4. is therefore not a depth. A reading of two feet means only that the water stands two feet above that gauge’s zero, and the river nearby may be much deeper in a Hole. Any pool deep enough to swim or fish in, named or not, the basic unit of the river in local speech; also “hole of water” (Chapter 18). Glossary → and much shallower on a Riffle. A fast, shallow, rocky stretch between pools. The riffles are the gardens of the riverbed: in July a square meter of riffle produced more than six times as much as a square meter of pool (Chapter 16). Glossary →.
Turning stage into flow takes field work. A crew stretches a line across the river at the gauge, wading at Low Water. The local name for the Highway Y bridge over the South Prong, the access beside it and the county’s low-water crossing where the prongs meet, and so for the head of the river (Chapter 8; Chapter 18). Glossary → and working from a bridge or a boat at high water, and stops at a few dozen points along it. At each point it measures the depth and the speed of the current with a meter, and from each strip of channel, width times depth times speed, comes a share of the flow. Added up, the strips give the flow at that moment, to be set beside the stage the gauge showed. Measurements made at many different water levels, each one plotted against its stage, trace out a Rating. The curve that gives a river’s flow for each stage at a gauge, built from measurements across the channel and redrawn as moving gravel shifts the channel (Chapter 14). Glossary →, a curve that gives the flow for every stage. The curve bends upward. At Alley a stage of 9 feet means about 6,960 cubic feet a second, 12 feet about 14,100, 16 feet about 32,800National Weather Service, gauge pages (ALYM7, flood categories)., and the 2017 crest of 23.29 feet about 94,200Heimann and others 2025, 6 (table 1)., because once the river is out of its banks each added foot of height spreads across the whole width of the valley floor. The channel shifts as gravel moves, so the rating drifts and has to be checked and redrawn. In 2001 a stage of 6.4 feet at Eminence meant about 3,100Wilson 2001, 3. cubic feet a second. By the present rating the same stage means about 3,560National Weather Service, gauge pages (EMCM7).. The largest flood flows are the least certain figures in any record, because no crew can wade a floodgeneral practice of stream gauging; on ratings (“stage-streamflow relations”), Heimann and others 2025, 4–6.. They lie at or beyond the top of the range that crews have been able to measure, and the rating has to be stretched to reach them.
The river’s year
The Jacks Fork country is one of the wetter parts of Missouri. Nine weather stations around the watershed averaged 43.21 inches of rain and snow a year between 1936 and 1995. April, May and June together brought 13.35 inches and December, January and February 8.81. May was the wettest month, at about five inches, and January the driest, at about two and a half. In single years individual stations recorded as little as 20 inches and as much as 64.5MDC 2001, PDF 68 (5.01, 2.61, 20.04 and 64.53 inches)..
The river follows the rain with a lag and a strong seasonal swing (Table 14.1). It runs highest from March through May and lowest in August, September and October. June belongs to the wettest quarter of the year, yet the river falls through it, because once the woods are in full leaf the trees Draw. A valley, in the usage of the Eleven Point side of the divide in Howell County (Chapter 18). Glossary → up much of the water in the soil and send it back into the airgeneral hydrology (evapotranspiration by the leafed-out forest in the growing season). through their leaves, and warm weather dries the ground besides. Summer rain mostly wets the soil and goes back up before much of it reaches the springs. In late fall the leaves come down, the ground stays wet, and the river rises again in November and stays up through the winter, the season with the least rainMDC 2001, PDF 68 (December to February, 8.81 inches)..
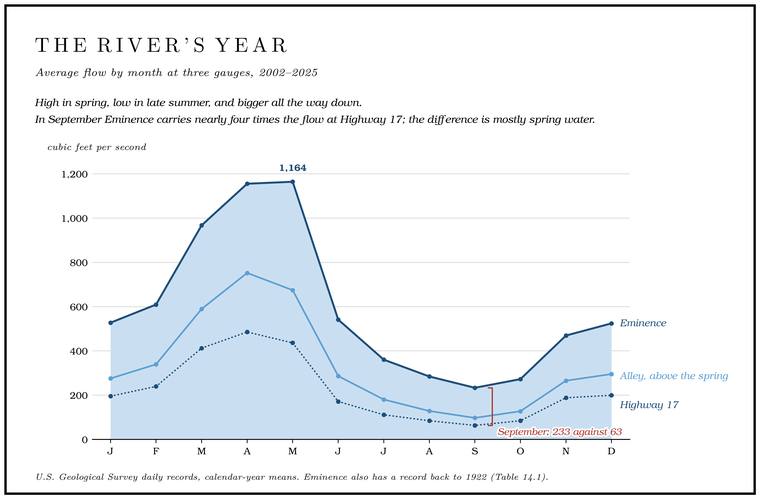
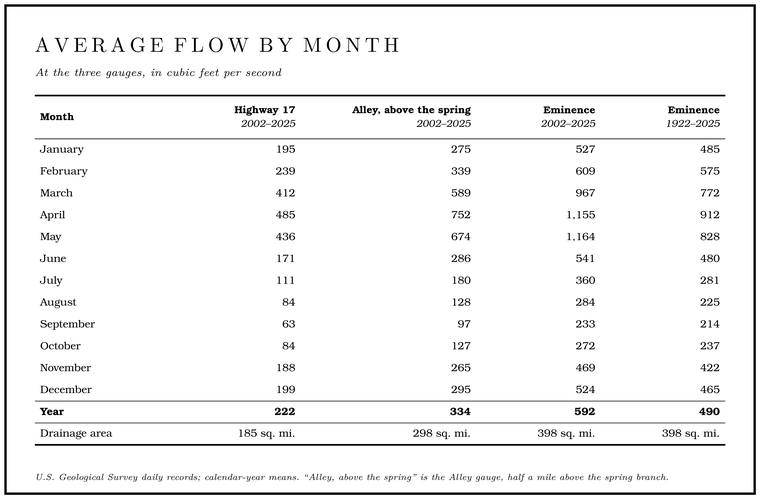
The swing is widest at the top of the river. At Highway 17 an average April carries almost eight times the flow of an average September; at Eminence the ratio is about five. In September the river at Eminence carries nearly four times the flow at Highway 17 from a little over twiceTable 14.1 (485 ÷ 63; 1,155 ÷ 233; 233 ÷ 63; 398 ÷ 185). the drainage area. The difference is spring water, chiefly from Blue Spring and Alley Springsee Chapter 12., which feed the river from below and change little with the seasons (Chapter 12).
Years differ as much as months. At Eminence the wettest years on record were 1927, 2020, 1985 and 1973, each averaging more than 940 cubic feet a second. The driest were 1954, 1936 and 1934, each under 180. In years like those the floods stay small. The biggest rise of 1934 at Eminence seems to have come in September and reached only 4.6 feet on the gauge, and that of 1954 about 5.5National Weather Service, gauge pages (EMCM7, crest history: September 15, 1934, 4.6 feet, 1,270 cubic feet a second; May 28, 1954, 5.5 feet, 3,400), the only entries for those years in a list that runs down to 4.58 feet. The list is not a complete file of annual peaks, hence seems to., both below the Action stage. The lowest of the Weather Service’s flood categories, a gauge reading at about bankfull, when the river is near the top of its banks. At Eminence it is 6.4 feet (Chapter 14). Glossary → there, 6.4 feetsee Table 14.4., when the river is about bankfull. At Highway 17 the driest year since 2002 was 2012, at about 90 cubic feet a second, and the wettest 2020USGS NWIS, annual statistics for gauges 07066000 (calendar years 1922–2025: 992.8, 982.2, 971.8, 942.0; 161.2, 173.8, 176.7) and 07065200 (2002–2025: 89.7; 346.6)., at about 347.
Low water
The flow that keeps a river running between rains is its Base flow. The flow that keeps a river running between rains. On the Jacks Fork most of it comes from springs (Chapter 12). Glossary →, and on the Jacks Fork most of it comes from springsWilson 2001, 2 (“derived mostly from inflow from springs”).. Because the springs drain large stores of water in the rock, the river’s low flows are high and steady for a river of its size. One way to put a number on that steadiness is to rank every day of the record by its flow. The flow that is equaled or exceeded on ten percent of the days is a wet-spell flow, and the flow equaled or exceeded on ninety percent of them is a dry-spell flow, and the ratio between the two shows how far the river falls between them. At Eminence the ratio is about seven to one. The Eleven Point River near Thomasville drains about the same area through country full of Losing stream. A creek that gives up its flow to the bedrock and runs dry for long stretches. Jam Up Creek, Pine Hollow and Johnny Hollow are the officially listed losing streams of the watershed (Chapter 12). Glossary →, and its ratio, 22.9, is about three timesMDC 2001, PDF 70, 78 (table Hy02, after Skelton 1976; Eminence 6.8). as great. Plotted from wettest day to driest, the Jacks Fork’s flows make a much flatter curve than those of the streams of northern MissouriWilson 2001, 2 (flow-duration curves)., which live on runoff from rain. The Current shows the same steadiness in the oldest measurements on the river. In the dry year 1913 the Current at Van Buren averaged 1,151 cubic feet a second and at its lowest still carried 540Sauer 1920, 50 (“a mean discharge of 1,151 second feet in 1913, had a minimum discharge nearly half as great, 540 feet”; a second-foot is a cubic foot a second)., nearly half as much.
Another standard measure is the seven-day low flow, the lowest average flow over seven days in a year. Averaging seven dayson the measure, Wilson 2001, 2 (“the average of the annual minimum 7-day consecutive daily average discharges”). smooths out the dip of a single dry afternoon and gives the flow the river can be counted on to hold through a dry week. At Eminence it falls to about 122 cubic feet a second or less in one year out of two, to about 86 in one year out of ten and to about 76MDC 2001, PDF 70. in one year out of twenty. When those figures were recalculated in 2001 with thirty-three more years of record, the once-in-ten-years low flow at Eminence came out nearly 14 percent higher than in the last analysis, made in 1966Wilson 2001, 2–3..
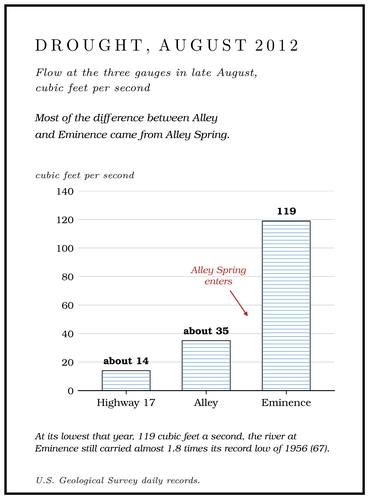
The lowest flows at Eminence come from the droughts of the 1930s and 1950s. The lowest instantaneous reading, 64 cubic feet a second, came on August 28, 1936, and the lowest daily average, 67, on September 16 and again on September 22, 1956USGS NWIS, gauge 07066000, daily statistics.. The upper river can fall much further, because the gauge at Highway 17 stands above the big springs. It set its record low in the drought summer of 2012, and in late August that year it was still carrying only about 14, the Alley gauge about 35 and Eminence 119USGS NWIS, daily values, July 20 to December 31, 2012, gauges 07065200 (12.9 on July 29; 13.9 on August 24), 07065495 (34.9 on August 24; 34.5 on August 25) and 07066000 (119 on August 23 and 24, the year’s lowest).. Most of the difference between the Alley gauge and Eminence came from Alley Spring (Chapter 12). At its lowest that year, 119 cubic feet a second, the river at Eminence still carried almost 1.8 times119 ÷ 67. its record low of 1956.
How the flow grows from spring to spring in a dry week was measured along the whole river in August 2006see Chapter 12. (Chapter 12).
The springs that stopped
In the early 1990s a federal hydrologist and an oral historianJacobson and Primm 1994, 1 (Robert B. Jacobson, research hydrologist, U.S. Geological Survey, and Alexander T. Primm, Oral History of the Ozarks Project). interviewed older residents of the Jacks Fork and Little Piney Creek basinsJacobson and Primm 1994, 38–40 (table 6). about the changes they had seen in their rivers. Most agreed that as springs had dried up between 1920 and 1992, the river had become “flashier,” with less water in it during low flow and larger floods. A flashy riveron the term, general hydrology. is one whose floods rise fast and fall fast. Drawn as a graph of flow against time, its flood is a tall, narrow spike, where a steadier river’s flood is a lower, broader hump that takes longer to arrive and longer to pass.
The springs they meant were small ones. A logger and farmer born in 1926Jacobson and Primm 1994, 39 (table 6); quotation, 55. put it plainly: “The water runs on down and don’t come out in the springs like it used to when I was a kid.” A man born in 1908 who had farmed and loggedJacobson and Primm 1994, 39 (table 6); quotation, 55. in the upper basin all his life described two springs on his own place: “I had a spring on the west end of my place, a little spring, run year round. And I had one on the east. And neither one of them runs anymore. They ran dry in dry years and they never did come back. Probably in the [19] ’40’s.” A man born at Alley Spring in 1907 remembered a sawmill campJacobson and Primm 1994, 39 (table 6); quotation, 55–56. that drew its water from a spring: “Springs that used to run big, don’t even run no more; I guess it’s the water level.” A woman whose family moved to the upper basin in 1911Jacobson and Primm 1994, 39 (table 6); quotation, 56. said the river “just doesn’t have the volume of water, outside of the floods.”
The same people remembered the river itself as deeper. A man who had farmed on the upper Jacks Fork since 1935Jacobson and Primm 1994, 39 (table 6), 56. had seen it “get up and stay up for 30, 90 days at a time,” and “you couldn’t cross that river, I’ll tell you, it was deep all the time. But now you can cross it pretty near anyplace.” A sawyer born in 1914Jacobson and Primm 1994, 40 (table 6), 56. who grew up near Bay Creek said the river got bigger in flood than it used to: “there’s too much runoff.” A woman who had farmed on the North Prong from the 1920sJacobson and Primm 1994, 39 (table 6), 56 (“in the last 5 years”). described the South Prong after timber was cleared upstream in the years before 1993: “the river just spread all over everything. Sometimes my house was just an island and the water was bank to bank.”
The gauge at Eminence has run through all of those years, and its record shows the river’s flow rising. Its yearly flow averaged 459 cubic feet a second from 1922 to 1950, 427 from 1951 to 1975, 502 from 1976 to 2000 and 578USGS NWIS, gauge 07066000, annual statistics, calendar years. from 2001 to 2025. Between 1936–65 and 1966–95, rainfall in the watershed rose about 8 percent and the river’s average flow about 20 percent, and the flow rose in every month except May, June and JulyMDC 2001, PDF 68–69.. The river’s seven-day low flows trended upward from the middle 1950s to 1999Wilson 2001, 2.. The lowest daily flows on record at Eminence came in 1936 and 1956USGS NWIS, gauge 07066000, daily statistics..
The two records describe different things. The small springs and Wet-weather creek, wet-weather spring. A creek or spring that runs only after rain (Chapter 18). Glossary → on hillsides and farms were never gauged, and their loss can be real while the big springs that feed the main river keep flowingsee Chapter 12. (Chapter 12). Several causes could lie behind what the older residents saw. Changes in land use could have altered how rain ran off, through changes in the woods and the streamside timber that had held water back and slowed it. Changes in climate could have altered the runoff by themselves. More of the river could be moving out of sight, through the gravelJacobson and Primm 1994, 55 (“land-use changes that altered annual and storm runoff, climatic changes that altered runoff independent of land-use changes, increased flow of water through aggrading channel gravel, or a combination of these mechanisms”); on vegetation, storage and flow resistance, 1. that had built up in the channels, since a thick bed of loose gravel carries part of a small river’s flow between its stonesgeneral hydrology., where nobody sees it. Any of these could combine with the others. The gravel and the filling of the holes are the subject of Chapter 15. Some people who know the river todaysee Chapter 12. hold the same belief, that the springs run lower than they used to (Chapter 12).
Springs had gone dry in droughts before, when some of the people interviewed were small childrenthree of them were born between 1904 and 1908 (Jacobson and Primm 1994, 39, table 6; see Chapter 15).. In the drought of 1913, which ran from April through AugustSauer 1920, 34, quoting a report from Springfield in the Monthly Weather Review, vol. 41 (Hazen, p. 1211). The report speaks for the Springfield country; that the Jacks Fork springs failed that year is not recorded., a weather report from Springfield, about a hundred miles west of Eminencemeasured, about 107 miles in a straight line., said that “wells have failed and springs and streams never before known to go dry are absolutely devoid of water.”
Why the floods come fast
Several features of the Jacks Fork country work together to make floods rise quickly. The valleys are narrow and steep-walled and the soils are generally thinHeimann and others 2025, 2., and thin soil holds little of a heavy raingeneral hydrology. before the rest runs off. Most of the channels in the watershed are hollows that run only after rainsee Chapter 2. (Chapter 2), and in a heavy storm they all carry water toward the river. The basin is steep for its size. The basin slope used in estimating floods is 9.5 feet a mile at Eminence, against an average of 5.8Wilson 2001, 2 (after Alexander and Wilson 1995: 9.50 and 5.80 feet per mile). for Missouri basins of similar size.
The Karst. Country shaped by dissolving rock, with caves, springs, sinkholes and losing streams. About 99 percent of the national riverways is karst (Chapter 1; Chapter 12). Glossary → works both ways. In an ordinary rain, Sinkhole. A hollow in the ground where rock below has dissolved or caved in, through which water drains underground; also called a sink, an American use (Chapter 2; Chapter 12). Glossary → and losing streamssee Chapter 12. swallow water that would otherwise run off (Chapter 12). In a heavy rain, fast runoff from the steep slopes and water recharging through the groundThornberry-Ehrlich 2016, 36 (after Alexander 1990). both contribute to flash flooding.
The weather adds a hazard. The Jacks Fork flows generally east, and weather systems generally move east too, so a storm moving east can travel down the valley along with its own flood. Large flood flows can catch floaters off guard downstream when little or no rain has fallen where they areWilson 2001, 3 (large flows can catch recreational users downstream off guard “if they have experienced little or no rain at their present location”).. The water can rise as fast as two feet an hour. It falls more slowly than it rises, and a flood typically lasts at least two or three daysWilson 2001, 3.. The highest flows come in April and May, and floods are least common in late August and early SeptemberThornberry-Ehrlich 2016, 36..
A resident who moved to the area in 1979 remembered friends who were camping at Pebble Dam on the upper Forks, the. The North and South Prongs and their junction, where the Jacks Fork begins; also called the Prongs (Chapter 18). Glossary → and were nearly swept away by a Flash flood. A sudden, fast rise of water after heavy rain, fed by quick runoff from steep slopes (Chapter 14). Glossary →, losing both of their vehiclesJacks Fork Oral History, record SV-05..
A flood also moves. Between Eminence and Van Buren, about 41 river miles, a flood crest takes about sixteen hours to travel from one gauge to the other, a little over two and a half miles an hourWilson 2001, 3 (2.6 miles an hour).. At that pace a crest that passes Eminence at breakfast reaches Van Buren late that nightsixteen hours..
Floods before the gauges
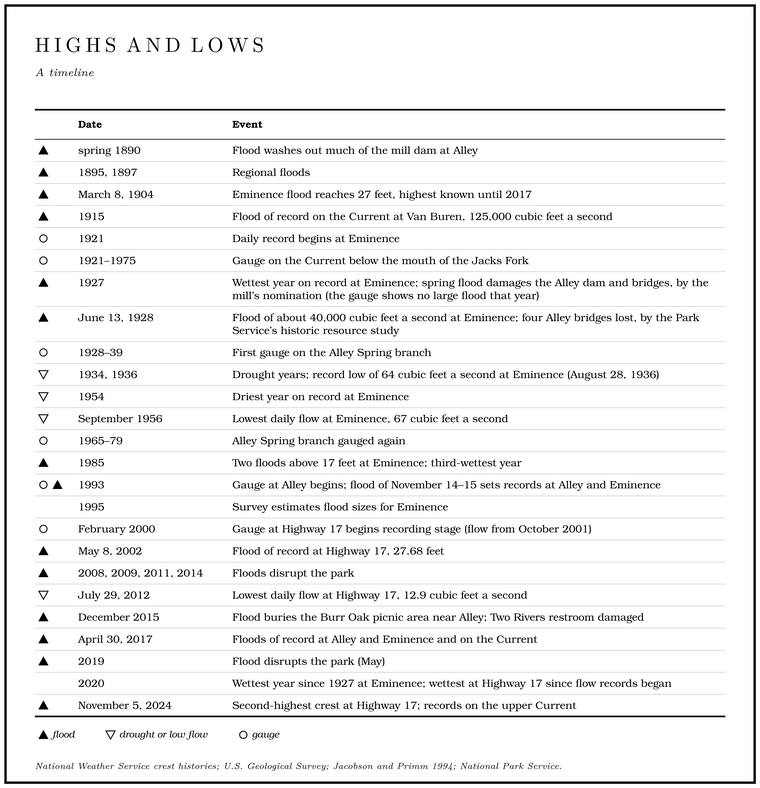
In the spring of 1890 a flood washed much of the mill dam at Alley away, and Charles Klepzig closed the mill and moved the post office to his house. He expected the repairs to take all summer. He seems never to have finished them, and he sold the mill in 1893Perry [1978], sec. 8. (Reach H). The rivers could rise very fast. In May 1892 the Current rose 27 feet in about eight hoursSauer 1920, 50–51, after Rodhouse (the Big Piney rose 30 feet between 4 p.m. and midnight that month, and “the Current River during this same month rose 27 feet in about the same time”)..
Great floods struck the whole region in 1895, 1897, 1904 and 1915. They came when the valley Bottom. The flat land along a river or creek, built of its deposits and open to its floods. In the 1920s the bottoms near Eminence averaged about a quarter of a mile wide (Chapter 2; Chapter 5). Glossary → had been cleared and grazed, and they could have done great damageJacobson and Primm 1994, 85 (after Reed and others 1992: “could have been extremely effective in destabilizing channels”). to the channels (Chapter 15). On the side creeks they are remembered by what they took. In 1895, by one account, a flood on Horse Hollow came down so big that it cut the river off and washed away a houseLewis 1980, PDF p. 55, the only source; see Reach I. (Reach I), and on Pine Hollow by Mahans Creek the Delaware School was washed off its foundation; by 1980 the schoolhouse was a churchLewis 1980, PDF p. 61, the only source..
The flood of March 1904 was long remembered as the largest on the Jacks ForkLewis 1980, PDF p. 71 (“March, 1904 was the largest flood remembered on the Jack’s Fork”).. At Eminence it crested on March 8 at 27 feetNational Weather Service, gauge pages (EMCM7, historic crests)., a mark that stood as the highest known until 2017. The same crest is also given as 25 feet, measured at another place or on another datumHeimann, Holmes and Harris 2018, 6 (table 1: historical peak stage 25.0 feet, 1904, “obtained at different location or datum from current streamgage”). than the present gauge. That year the Current at Van Buren rose to 29 feet, with a flow estimated at about 153,000 cubic feet a second, and on both rivers the highest stages of 1904 stood for 113 yearsHeimann, Holmes and Harris 2018, 6 (table 1: 153,100 cubic feet a second and 29.0 feet, 1904; the same table gives the first recorded peak at Van Buren as March 26, 1904, so the Van Buren crest may belong to a later rise of that March than the Eminence crest of March 8), 16 (the previous stage records on the Jacks Fork and the Current “had stood since 1904”)..
At 125,000 cubic feet a second, the flood of 1915 was the largest in the regular record at Van Buren, which began in 1913Wilson 2001, 4 (“the peak flood of record”); the record years from Heimann and others 2025, 6 (table 1: 1904, 1913 to present)., and nothing in that record matched it until 2017Heimann and others 2025, 6 (table 1: 179,000 on April 30, 2017).. The year was a very wet one across the Ozarks. June and August broke the monthly rainfall records in parts of the region, and in August seven widely scattered stations recorded more than ten inches above the month’s average rainfall. Grain rotted in the fields, and that summer almost every large river and creek in the Ozarks was out of its banks two to five times, cutting off many places from each other for days at a timeSauer 1920, 33, 51 (after the state’s Climatological Data; 1915 “one very wet” year among three dry ones, 1911–15).. The man who had farmed the upper river since 1935 grew up on a farm on the CurrentJacobson and Primm 1994, 39 (table 6), 60. near the mouth of the Jacks Fork, where his family moved in 1915. He remembered that the flood that year carried off their shocked corn and left the fields: “It just cleaned off everything that we had. We didn’t lose no soil. It took what we raised.”
The year 1927 was the wettestUSGS NWIS, gauge 07066000, annual statistics (calendar 1927, 992.8). at Eminence in more than a century of record. By one account a flood in the spring of that year destroyed a large part of the dam at Alley, carried away the headgate and took out four bridges recently builtPerry [1978], sec. 8, continuation p. 2; Perry’s note 10 cites the Game and Fish reports for 1925, 1926 and 1930 but none for 1927 or 1928. across the spring branch in the new state park. By another the bridges went in June 1928, with the park’s new storeStevens 1991, 182, as given in Chapter 8; Lewis 1980, PDF p. 53 (“In 1928 a big flood washed the store away”); Stevens (189, note 35) cites the Annual Report of the State Game and Fish Commissioner for the Year Ending December 31, 1928, 45–46. (Chapter 8; Reach H), and the gauge favors 1928: the crest record for Eminence lists nothing in 1927 higher than 8.8 feetNational Weather Service, gauge pages (EMCM7: June 2, 1927, 8.8 feet, 10,900 cubic feet a second).. The flood of June 1928 crested there at 18.24 feet and about 40,000 cubic feet a second on June 13National Weather Service, gauge pages (EMCM7). (June 15 by another record), about a ten-year floodJacobson and Primm 1994, 56 (bracketed note: “June 15, 1928, 40,000 ft3/s at Eminence, approximate 10-year recurrence interval”).. The sawyer who grew up near Bay Creek remembered it as the “’26, ’27 flood”Jacobson and Primm 1994, 56. and remembered what it did to the small farms in the creek bottoms: “that year it come and most everyone had just plowed, and you know the topsoil was real loose. And the creek got all over the bottom in each of these valleys and it wash every bit of that dirt off and then a lot of them had to leave.” On Bay Creek, by one account, the 1928 flood ruined most of the small farms, took the mule barn at one of the sawmills and drowned several mulesLewis 1980, PDF p. 40, the only source; see Reach F. (Reach F). In Alley Hollow the farms were turned into Gravel bar. A bank of chert gravel and sand, usually on the inside of a bend, bare at low water (Chapter 15; Chapter 18). Glossary →, and a truck parked a quarter of a mile up the hollow was washed down it into the spring branchLewis 1980, PDF p. 53, the only source; see Reach H. (Reach H).
The gauged floods
Table 14.2 lists the great floods at the three gauges. Floods at Eminence reached 16.54 feet in February 1966, 17.03 in April 1983, and 17.15 in February and 17.58National Weather Service, gauge pages (EMCM7). in November of 1985, the third-wettestUSGS NWIS, gauge 07066000, annual statistics (calendar 1985, 971.8). year on record there. By one account a big flood came down Alley Hollow on February 9, 1966, a day before that winter’s crest at Eminence, and in April 1974 a gully washer drowned three people in a camperLewis 1980, PDF p. 53, the only source; see Reach H. at the hollow’s mouth (Reach H). The Eminence gauge crested at 15.83 feet on April 22, 1974, about 40,600National Weather Service, gauge pages (EMCM7, crest history). cubic feet a second.
The autumn of 1993 brought two floods. Rain from September 23 to 25 raised the Jacks Fork to heights of 13 to 25 feet, and rangers moved campers off the primitive and backcountry sitesNPS Morning Report 1993a (“Flood waters reached heights between 13 and 25 feet on the Jacks Fork”). before the water came. Eminence crested at 16.32 feet on September 25National Weather Service, gauge pages (EMCM7)..
The flood of November 1993 was the highest at Eminence since the daily record began in 1921, and the highest at Alley in that gauge’s short record. The Alley gauge crested at 21.97 feet and about 48,700 cubic feet a second on November 14, and Eminence at 19.82National Weather Service, gauge pages (ALYM7, EMCM7). feet the next day, when the river there averaged 31,800MDC 2001, PDF 69, 79 (table Hy03). cubic feet a second for the whole day. The peak flow at Eminence was about 58,500National Weather Service, gauge pages (EMCM7, crest history; the November 1993 flood falls in water year 1994); MDC 2001, PDF 79 (table Hy03, after USGS 1999), prints 48,500. cubic feet a second. Many people took the 1993 flood on the Current at Van Buren for a 100- to 500-year event. By the flood-frequency estimates it was only a little larger than a 25-year floodWilson 2001, 4 (Van Buren, 92,900 cubic feet a second). there, and at Eminence it was nearly a 50-year flood58,500 against Table 14.3 (50-year flood, 59,500)..
More than eight inches of rain had fallen on parts of the park, and afterward the park called it “the largest flood in the history of the Current River.” In the park’s Jacks Fork district fourteen restrooms stood under more than ten feet of water. At Alley, Harvey’s motel by the Highway 106 bridge had six to seven feet of water in it and the store three feet in its living quarters, and the park’s Alley center had a foot and a half. The district’s fee booth quarters and office had three feet and lost their appliances and furniture. The current peeled the asphalt off one loop of the Alley campground, and across the district it carried away picnic tables, grills, lantern posts, signs and trash cans. About 250 hunters were stranded in the park, a capsized boater was lifted out on a line from a state patrol helicopter, and no visitor or employee was killed or hurtNPS Morning Report 1993c (the park’s follow-up, filed November 16; “Fourteen comfort stations,” “the Alley Center is under 18 inches of water,” “The fee booth quarters and office had three feet of water inside”). The report lists the restrooms, tables and fee booth by district, not by place, so only the motel, store, Alley center and campground loop are put at Alley here. For Harvey’s by the Highway 106 bridge, see Chapter 11.. The governor declared the south-central part of the state a disaster areaNPS Morning Report 1993b..
The flood of May 8, 2002, was greatest at the top of the river. The gauge at Highway 17 crested at 27.68 feet and about 43,700Heimann and others 2025, 6 (table 1). cubic feet a second, a record that still standsHeimann and others 2025, 4; National Weather Service, gauge pages (JKFM7).. The same flood crested at only about 17 feetNational Weather Service, gauge pages (ALYM7 17.10; EMCM7 17.22). at Alley and at Eminence, well below the marks of 1993. More than seven inches of rain had fallen in two days, and it was the park’s first major flood since 1993. At Buck Hollow the water rose over a visitor’s car before it could be driven out, the ranger station at Alley stood in two feet of water, and the park closed for a day while the river went down. Uprooted trees left Strainer. A tangle of fallen trees, branches or roots that lets water through and stops anything larger. Rootwads, the tangled roots of fallen trees, are one kind. The current can pin a boat or a person against a strainer (Chapter 14; Part Six). Glossary →NPS Morning Report 2002. in the river, trees lodged in the current with their branches in the water, which can pin a boat or a swimmergeneral. against them.
Other floods disrupted the park in March 2008, August 2009, April and May 2011, July 2014 and May 2019Heimann and others 2025, 2 (after National Park Service 2024a).. The flood of December 28 and 29, 2015, reached 21.9 feet at Highway 17 and 16.15National Weather Service, gauge pages (JKFM7, EMCM7). at Eminence. It covered much of the Burr Oak picnic area near Alley with gravel and sand and took the roof and part of the walls off the restroom at the Two Rivers boat landing. The park’s early estimate of the damage, parkwide, was nearly a million dollarsNPS 2016 (flood) (“heavily impacted by gravel and sand deposited across the landscape”).. The rain behind it fell on December 26 and 27, nine to twelve inches in many places, heaviest along the Interstate 44 corridor to the north. It was the year’s most serious weather across the Weather Service’s Springfield district, where thirteen people died in the flooding, and it gave Springfield its wettest December on record. West Plains had 9.04 inches that month, its third-wettestNational Weather Service, Springfield 2016 (the office’s review of the weather of 2015, which ranked the December flood first: “Very heavy rain fell centered along and either side of the interstate 44 corridor,” “Many places received 9 to 12 inches,” “13 confirmed deaths”; Springfield 11.43 inches, and West Plains third-wettest, under its eighth event, “Wettest December on Record”). December.
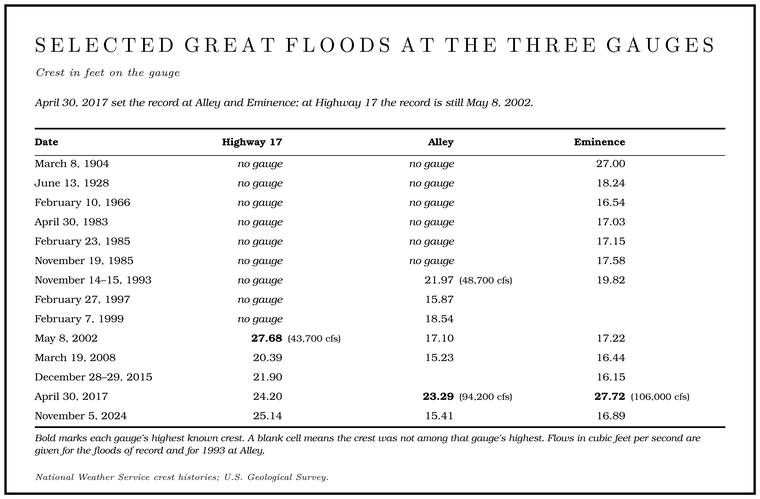
Bold marks each gauge’s highest known crest. A blank cell means the crest was not among that gauge’s highest. Flows in cubic feet per second are given for the floods of record and for 1993.
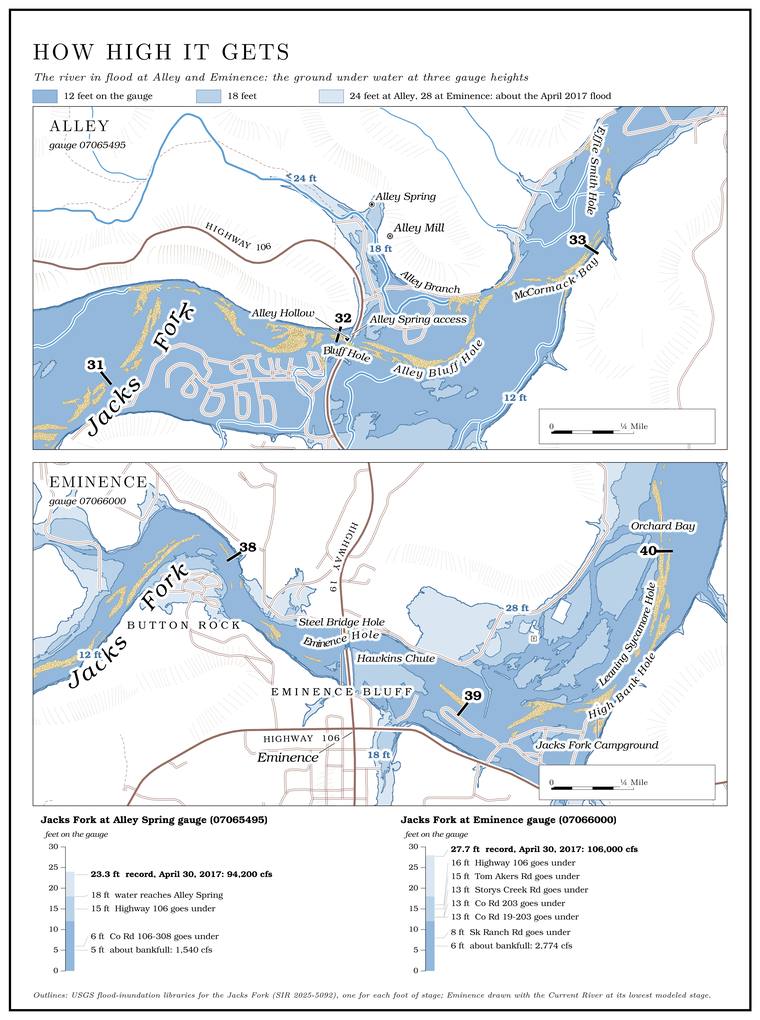
A reading on the gauge can be turned into ground under water. On the flood maps modeled for the river, at Alley the campground loop roads beside the Highway 106 bridge begin to go under at about 6 feet on the gauge, the approaches to the bridge at about 15, and at about 18 feet the river backs up the spring branch to the spring. At Eminence, County Road 203 and Storys Creek Road go under at about 13 feet, Highway 106 east of town at about 16, and Riverview Drive and Old Highway 19 at about 20. Main Street and Highway 19 go under only at about 28 feet, in a flood like that of 2017. On that scale the Eminence crest of June 1928, 18.24 feet, would have put the low roads and Highway 106 east of town under water, and those of 1904 and 2017Map 14, drawn from the modeled flood-inundation map libraries of Heimann and others 2025 (one outline per foot of stage at the Alley and Eminence gauges; at Eminence with the Current River at its lowest modeled stage). The outlines are modeled, not observed, and the stages are rounded to the foot; the crests are from Table 14.2., 27 and 27.72 feet, reached nearly to the town’s main street (Map 14).
April 2017
The flood of April 30, 2017, set new records at seven of the eight gauges on the Current and the Jacks Fork. The exceptionHeimann and others 2025, 1, 4. was the gauge at Highway 17, where the river crested at 24.2 feetNational Weather Service, gauge pages (JKFM7)., below its mark of 2002. At Van Buren the Current crested 8.4 feet above its old high mark of 1904Heimann, Holmes and Harris 2018, 16.. At Eminence, where water reaches the deck of the Highway 19 bridge at 26 feet on the gauge, the river rose to 27.72National Weather Service, gauge pages (EMCM7, impacts and crests)..
Floodwater damaged homes and businesses in Eminence, Van Buren and Doniphan, and the damage in Missouri was estimated at $86 million. Rangers rescueHeimann and others 2025, 1–2 (after State Emergency Management Agency 2017).d visitorsNPS 2017 (reopening). caught by the water. At Alley, about a foot of water stood on the main floor of the mill and four feet in the Storys Creek SchoolNational Parks Traveler 2017.. Across the park 33 structures were destroyed and 99 more critically or seriously damaged, with most of the assessment done. “We’ve never seenNational Parks Traveler 2017 (Superintendent Larry Johnson). this level of destruction in this park,” the park’s superintendent said. More rain followed, and a second rise crested at Eminence at 14.32 feet on May 4National Weather Service, gauge pages (EMCM7, crest history); for the rain that went on to May 10, Heimann, Holmes and Harris 2018, 1.. By May 19NPS 2017 (reopening). the Jacks Fork was open to floating from Buck Hollow to Alley, while the river from Alley to Two Rivers stayed closed “until safety hazards can be mitigated.”
What the flood did to the store at Two Rivers, the trail-ride camp and the campgroundssee Chapter 11. is told in Chapter 11, and what it did to the Alley footbridgesee Chapter 8. in Chapter 8. What it did to the gravel and the swimming holessee Chapter 15. is the subject of Chapter 15.
November 2024
Rain began on November 3, 2024, and totals of nine to twelve inches across the upper Current’s watershed brought record flooding from Montauk to Round Spring on November 5. The Current set new records at Montauk and at AkersHeimann and others 2025, 2, 6 (table 1, note 3)., where the gauge stopped reporting at 23.23 feet with the water still rising; the crest there was estimated at about 32 feet, against the old record of 26.08NPS 2024 (flood). from 2017. On the Jacks Fork the gauge at Highway 17 crested at 25.14 feet on November 5, its second-highest mark. Downstream the flood was smaller, 15.41 feet at Alley and 16.89National Weather Service, gauge pages (JKFM7, ALYM7, EMCM7). at Eminence. The Alley Spring campground was expected to stay closed for several weeksNPS 2024 (flood); see Chapter 11. (Chapter 11), and the changes the flood made near Blue Springsee Reach D. are described in Reach D.
What a 500-year flood means
A “100-year flood” is a flood with a 1 percent chance of being equaled or exceeded in any given year, and a “500-year flood” one with a 0.2 percentWilson 2001, 4; Heimann and others 2025, 1. chance. The names describe odds. A 500-year flood can come twice in a decade or not at all in a thousand years. Over thirty years the chance of at least one 100-year flood is about one in four, and of at least one 500-year flood about one in seventeen1 − 0.99³⁰ ≈ 0.26; 1 − 0.998³⁰ ≈ 0.058..
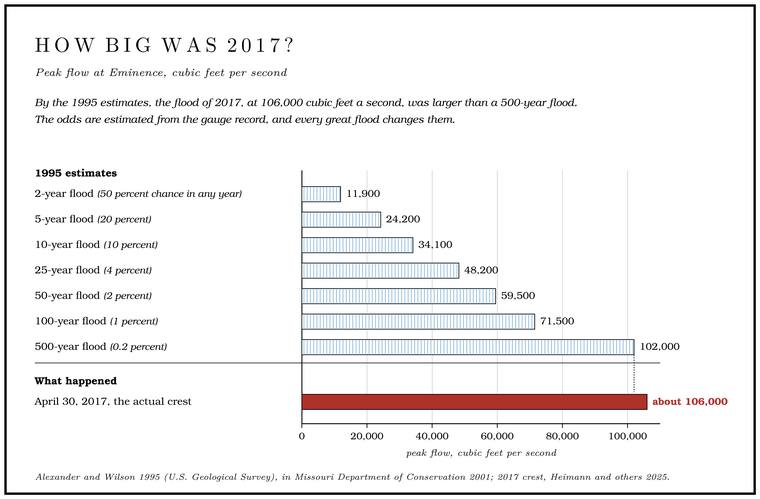
The odds are estimated from the gauge record. Hydrologists take the highest flow of each year, rank those yearly peaks from largest to smallest, fit a smooth curvegeneral practice of flood-frequency analysis. through them, and read the 10-year, 50-year and 100-year floods off the curve. A 500-year flood lies far beyond anything a record of seventy or eighty years can show directly, so its size is read from the far end of the curve, and every great flood that joins the record changes the curve and the odds. Estimates made in 1995see Table 14.3. from the record at Eminence gave the flood sizes shown in Table 14.3. By those figures the flood of 2017, at 106,000 cubic feet a second, was larger than a 500-year flood106,000 against 102,000.. Estimates made after the flood put the 2017 peaks at selected gauges on the two rivers at 200 to 500 yearsHeimann and others 2025, 1 (after Heimann, Holmes and Harris 2018).. At Eminence the analysis made after the flood gave the 2017 peak an annual chance of about 0.2 percent, a 500-year flood, and the Current’s peak at Van Buren about 0.47 percent, roughly a 213-year flood. Figures like these carry wide margins. For Eminence the range the analysts gave at two-in-three confidence ran from 0.2 percent a year to 1.8 percent, from a 500-year flood down to something nearer a 55-year one1 ÷ 0.018.. The same record pins down the common floods far better. The 2-year flood at Eminence, put at 12,600Heimann, Holmes and Harris 2018, 22 (table 3: annual exceedance probability of each 2017 peak with its 67-percent confidence interval; Eminence 0.20 percent, interval 0.2 to 1.8; Van Buren 0.47 percent; the 50-percent, or 2-year, flood at Eminence 12,600 cubic feet a second, 95-percent limits 10,700 to 14,800). cubic feet a second in the same analysis, is reached or passed in about one year in two, while nearly a century of yearly peaks96 annual peaks at Eminence through 2017 (Heimann, Holmes and Harris 2018, 6, table 1). holds only one flood the size of 2017.
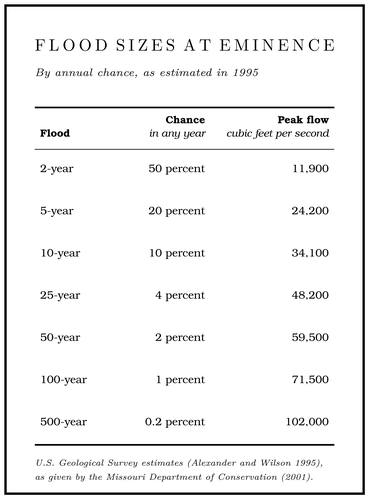
Floods of about the 25-year size have historically done major damageWilson 2001, 4. to the park’s facilities in the Floodplain. The flat valley floor that a river builds and floods (Chapter 2). Glossary →. In 2001 the Missouri Department of Transportation typically designed its bridges for the 50-year flood, which does not mean that a bridge failsWilson 2001, 4. when a larger flood comes.
Reading the gauges
The Weather Service sorts gauge readings into categories. The lowest, the action stage, is about bankfullHeimann and others 2025, 1., when the river is near the top of its banks. Minor, moderate and major Flood stage. A gauge reading at which the river floods. Above the action stage the Weather Service sets minor, moderate and major flood stages for each gauge (Chapter 14). Glossary → follow. For each gauge the Service also keeps a list of what happens at each level (Table 14.4). The Park Service uses the same gauges to decide when to close the river to floatingWilson 2001, 3 (table 1); see Part Six., and those closing levels are given in Part Six. At Eminence the no-float level of 6.4 feet stood in 2001 for a flow about 6.7 times the river’s average. The river rose past it on five days in 1998Wilson 2001, 3., and on seven days a year on average over the ten years before 2001.
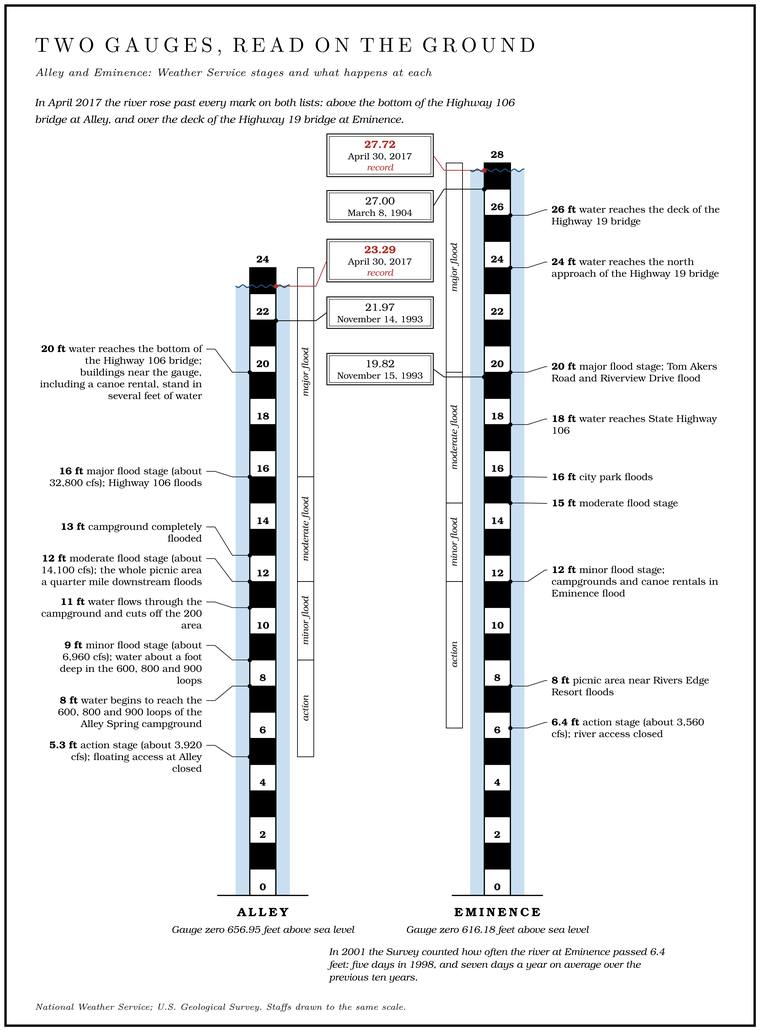
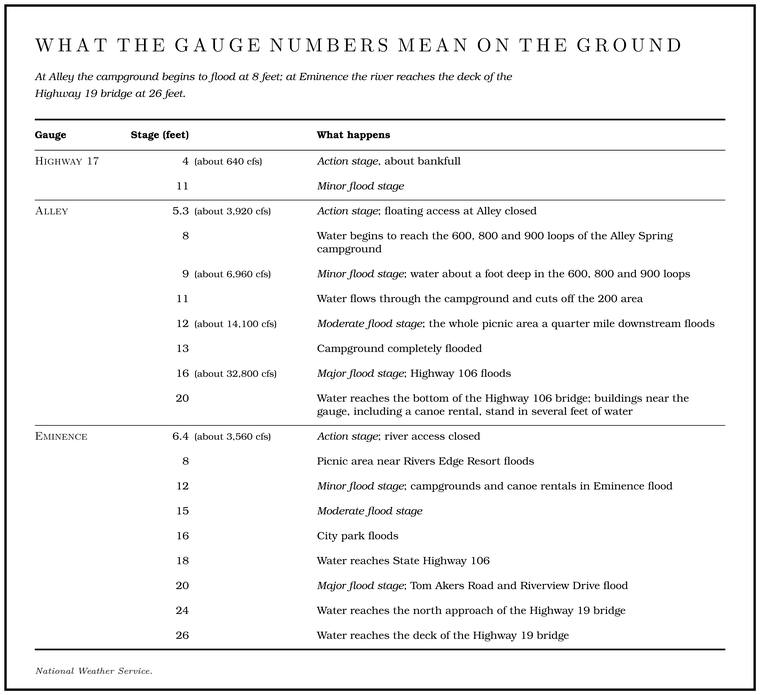
Because the floods travel downstream at a few miles an hour, a reading upstream is the best warning of what is coming. The gauge at Highway 17 was installed in 2000 to give earlier warningWilson 2001, 3 (“will offer faster flood detection and warning capability”). of floods on the river below.